
Metrics Overview
The Metrics team had shipped and were slated to ship a bunch of features. As our product was growing, so was the pain of understanding it.
This project was a design-initiated and design-led project that aimed to demystify and communicate the full value of our growing product.
My First Step
My first step for this large initiative was to validate and flesh out my understanding of the problem - through interviews with real external users. I also brought my PMs along for the ride so that they trust the research and hear user anecdotes first hand.
For context, our customers send us data about their applications and infrastructure to get "eyes" into what's happening with their product. The Metrics product offers various features that processes the data differently for different use cases, but it can get quite complex for users.
From the initial research we were able to align on a general strategy for what "jobs" we wanted this page to do.
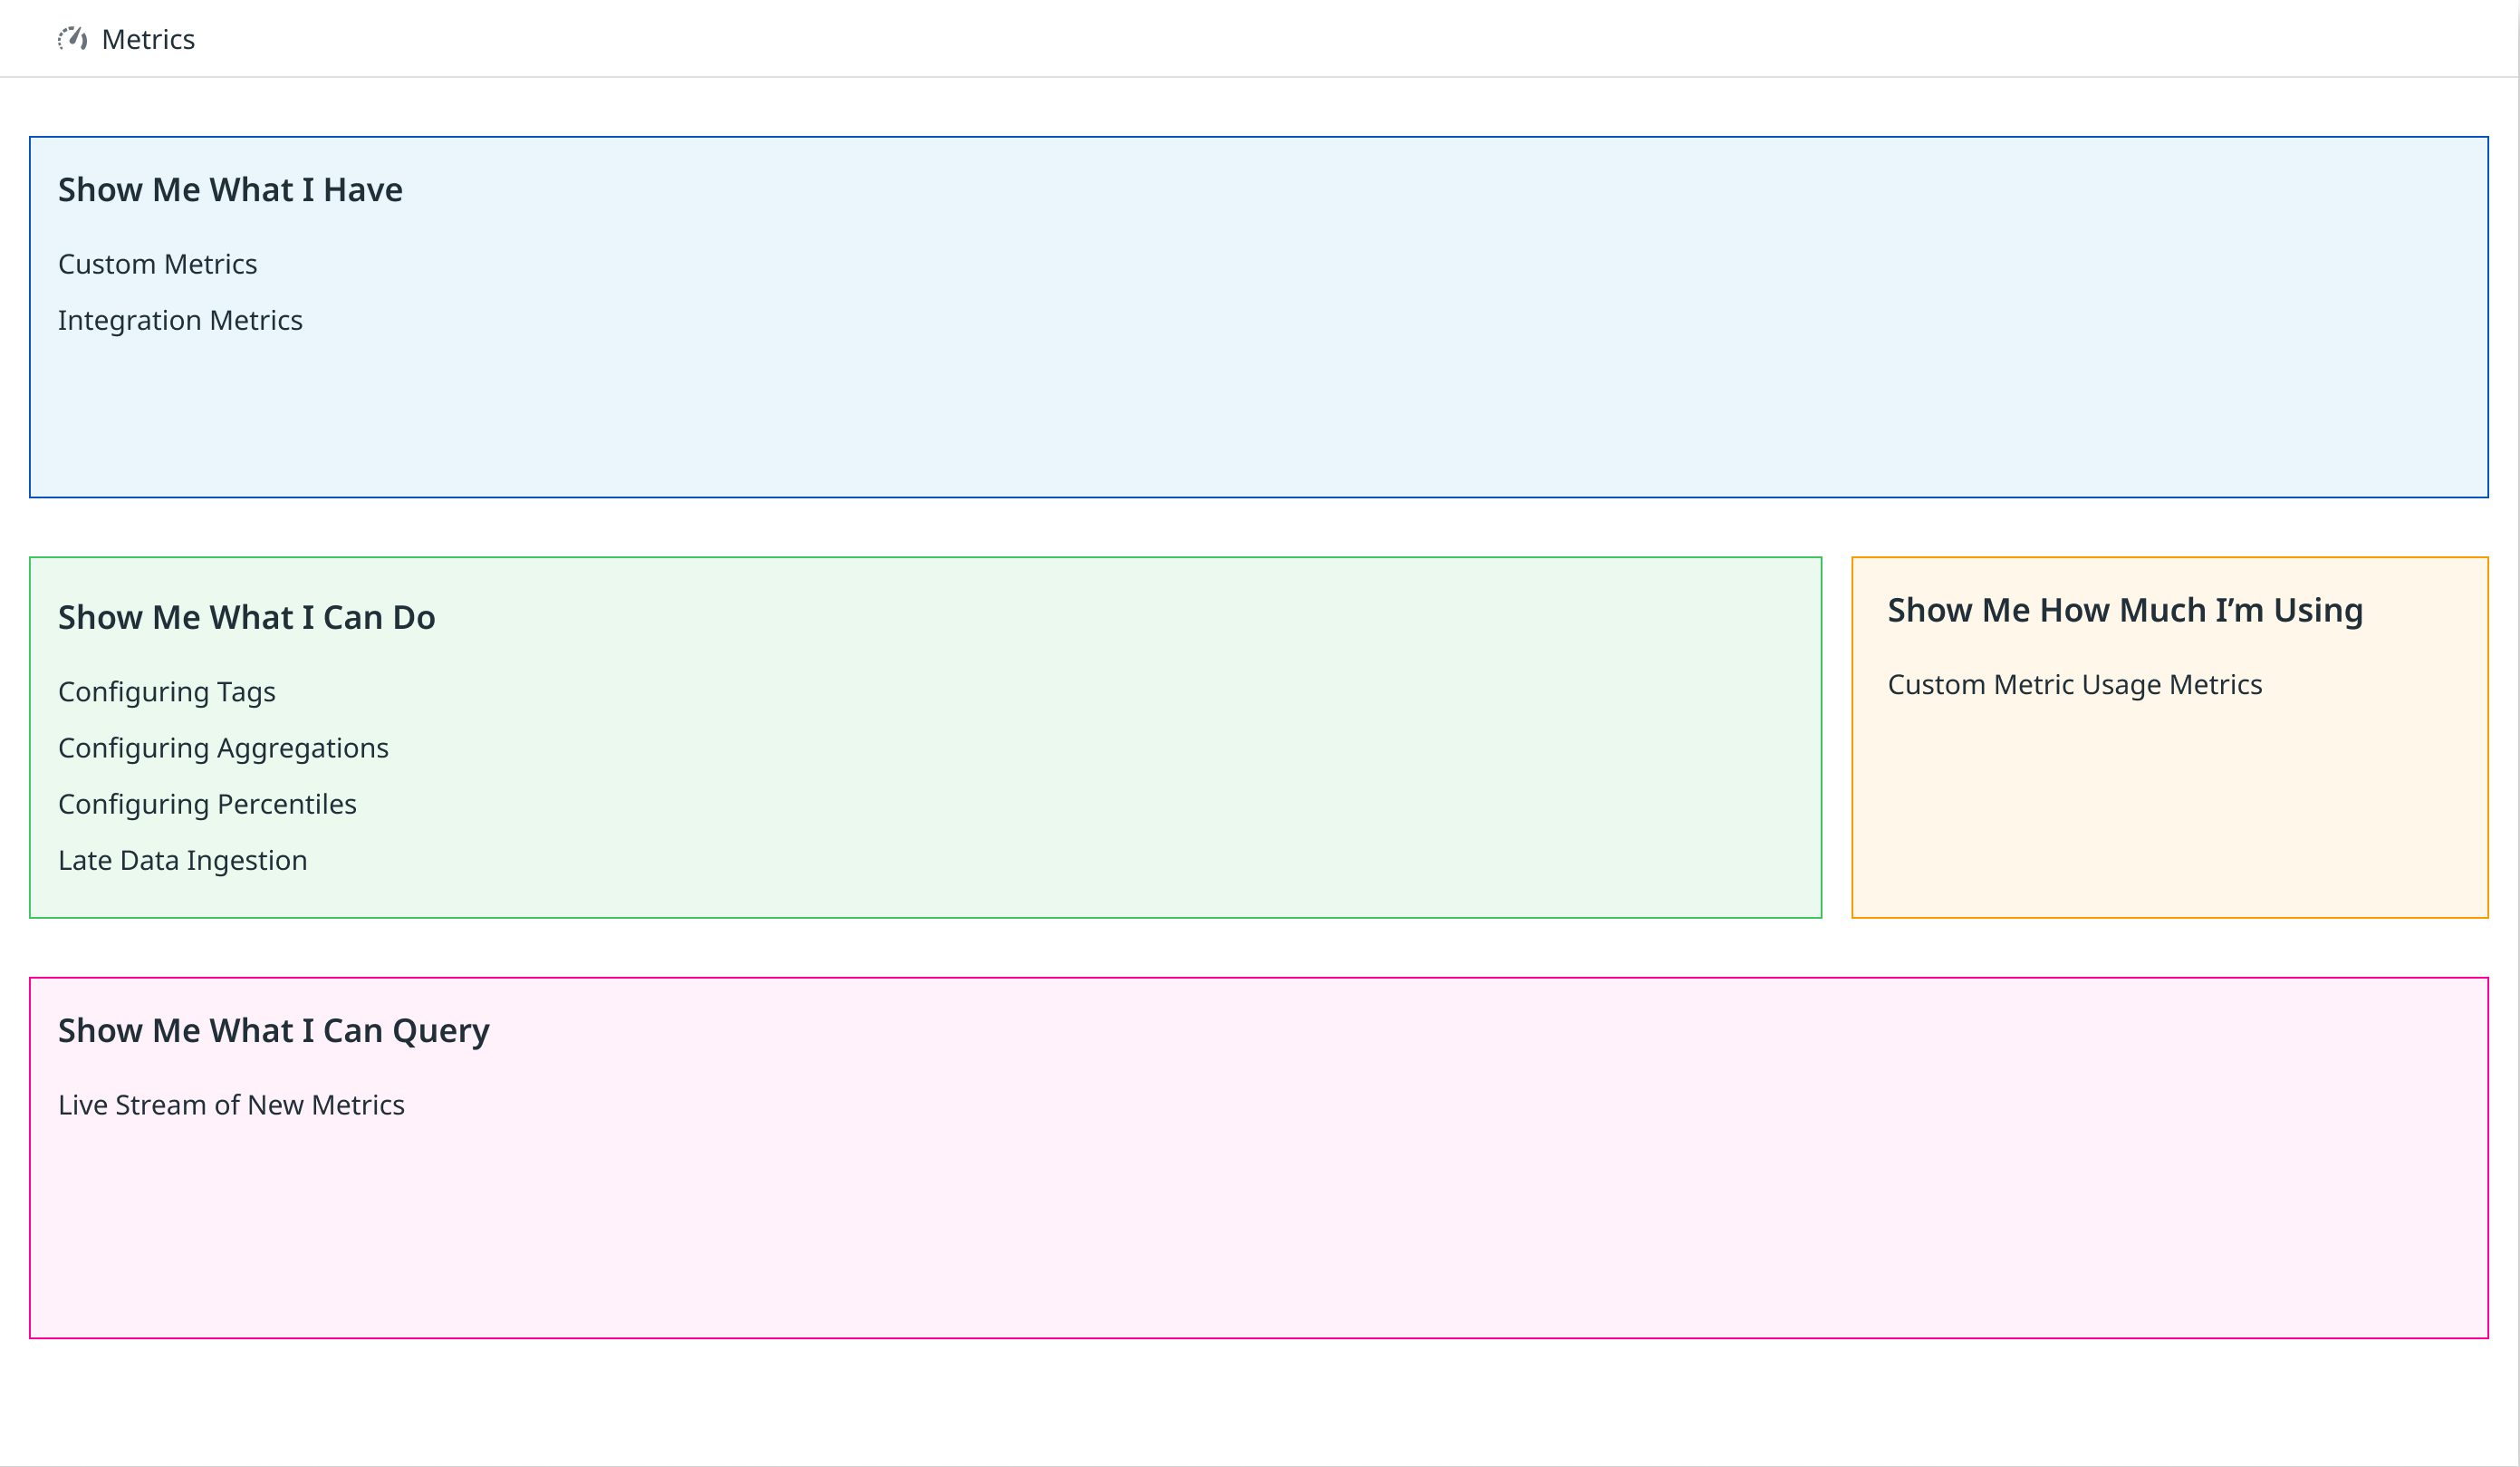
Many Stakeholders 👀
It was at this point I started regularly working with our onboarding design team and started checking in with our CEO, Oli, who had a vested interest in this project.
Fast forward many iterations, research sessions, and design crits later, we presented this design proposal to Oli. It told a long-scrolling interactive story on where a user's data is coming from and how that data gets processed in Datadog, with feature upsells and explanations at relevant points.
.gif)
We Got It Wrong 😭
... and we got it wrong. While we had aligned on our problem statement and general strategy, we didn't get the execution right. To him it focused too much on details that didn't matter, and not enough on the bird's eye view of things. It was back to the drawing board.

Working With Our CEO
Our CEO Oli had a very specific vision for how to solve the problem of making our metric platform easier to understand - it was something he had envisioned for the product many years ago. To help us understand what was in his head, he sketched this out for us.

Given our limited feedback loops with Oli, designing with this level of ambiguity was a challenge throughout the project.
Communicating Value Props
Datadog is a complicated product, and Metrics is one of the most complicated on the platform. Each feature we shipped was another layer of complexity to untangle. How could we use design thinking to simplify the value props of the work we were doing?
We found that more concise use-case focused copywriting and simplified illustrations helped a lot.

Maximizing User Value
The tightrope of un-constrained design solutions (and its engineering cost) and tightly-bound design solutions (and its cost on user value) was a tricky thing to balance.
One of our early proposals of a "livetail" of metrics, which would give users a great sense of what actual data was coming in, would be too much of an engineering investment to work. It took fully understanding our existing backend architecture and constraints to deliver the most optimal UX solution given the circumstances.

FINAL DESIGN
Bird's Eye View of Metrics
It took a couple more checkpoints with Oli to fully execute on our design goals that served both our stakeholders and our users. We also brought in one of our Dataviz designers to fully polish this part of the UI since it deserved it.
Instead of a long-winded scrolling story, users get a birds-eye view of their metrics.

Drill Down Into Your Data
Users can then drill down and specifically see where their data is coming from.

Our Product Features
Use-case driven copywriting and simplified illustrations clearly illustrate the value behind the additional features we offer.

Check What You Have
Instead of a livetail of all of their metrics, users can search for a specific metric and see all of the information they want to see in one view.

Learn How to Query
After users learn where their data is coming from and what features they can enable, they can learn how to slice and dice that data to get any additional insights they need.

Reflection
Stakeholder Management
Some of of the biggest things I learned were:
1. Stakeholder alignment on the problem, the strategy and the execution can be very different things. Be careful with any assumptions of alignment especially when stakeholders are very involved.
2. How to keep our decision making clear across multiple layers of management, and more effectively receive and filter feedback from multiple parties.
Metrics and Measuring Success
Some of the success metrics we were tracking were:
1. New user conversion rates and general usage metrics for the features we promoted.
2. Reduction in customer tickets regarding the confusion and pain points this page was intended to solve for.